Site URL
Launch Date
Problem
Solution
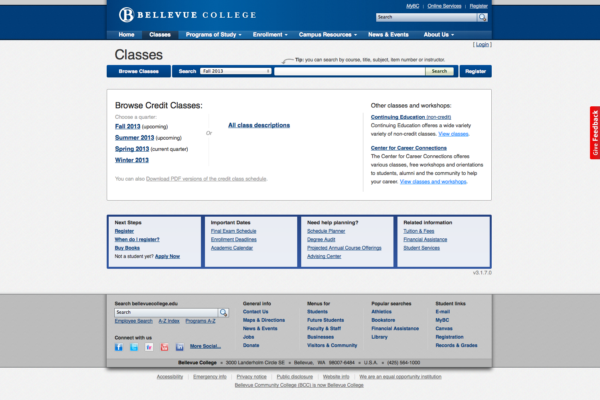
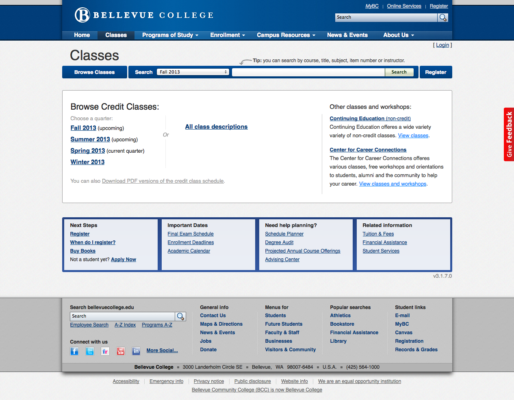
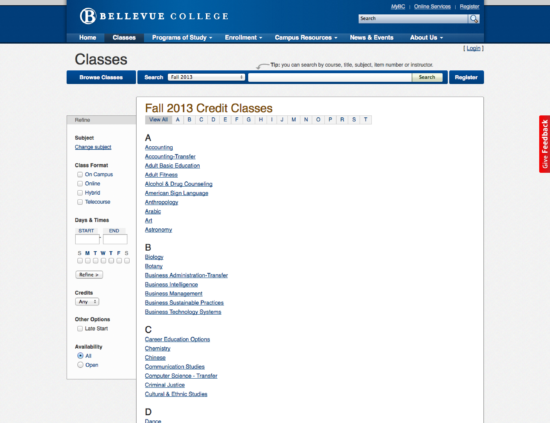
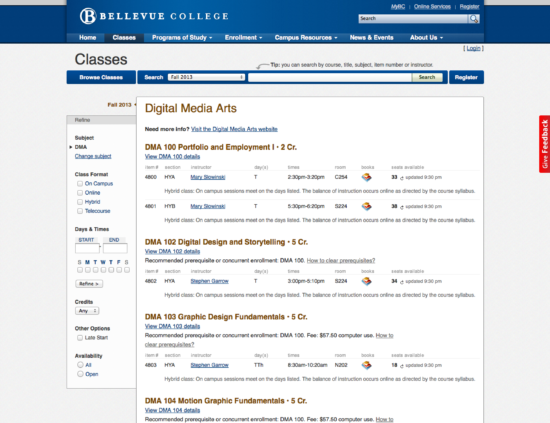
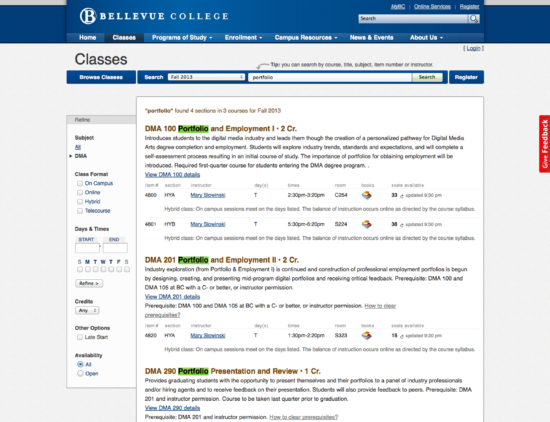
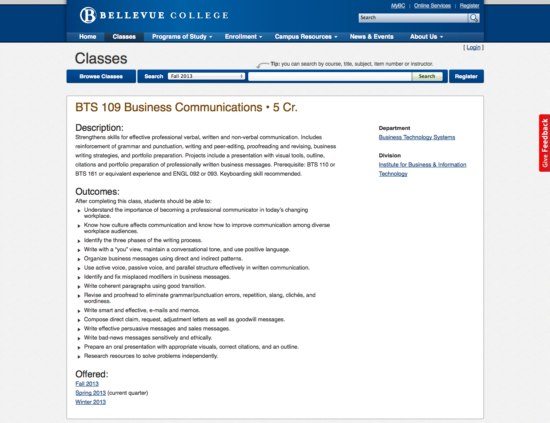
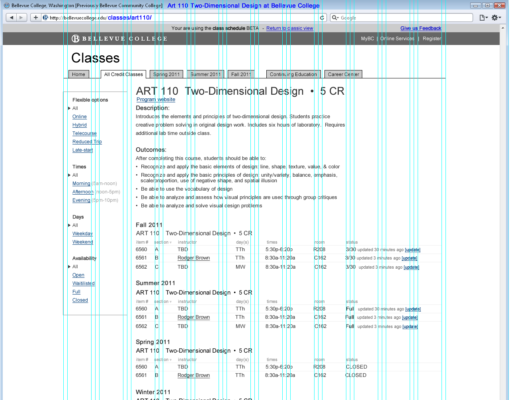
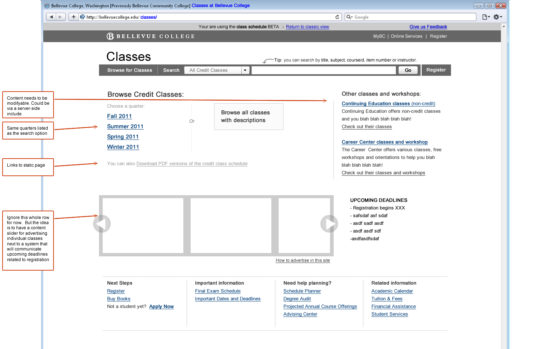
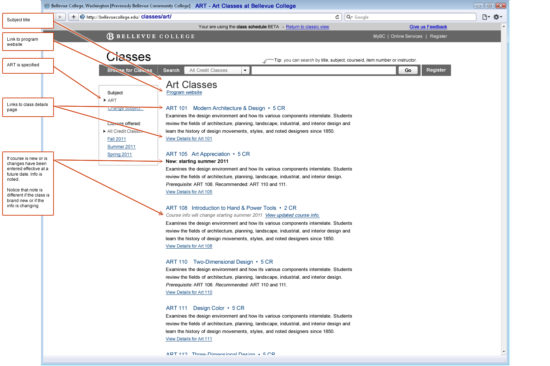
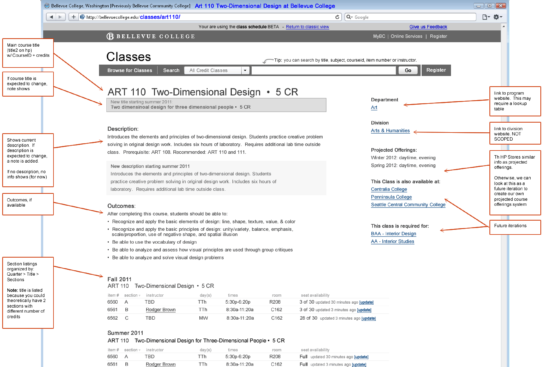
Screenshots
Win-Win-Win
- Helps close to 15,000 students a year plan their quarterly schedules and register for classes they need.
- Provides up-to-the-second class availability, which reduces stress related to closed classes. This not only gives accurate course availability, but also reduces overloads to the online registration system.
- Provides detailed class information, including course descriptions, prerequisites, outcomes and projections of when the class is offered, to better help in degree planning.
- Speeds up the workflow related to the print-production process of the quarterly class schedule.
- Simplifies all class information into “Classes,” reducing jargon required to find course information and quarterly listings.
- Other colleges are able to use the shared codebase, such as Peninsula College.
Proof of Concept
This proof of concept also uncovered that through the database, we had access not only to course descriptions and prerequisites, but access to other information that was previously not publicly published, such as course outcomes and information as to which quarters we anticipated a class to be offered.
Initial Stakeholder Research
I began by interviewing key stakeholders across academic divisions as well as the publication manager to get some historical perspective and a full sense of the lifecycle of class information. This gave me a sense of the full paper-based and digital workflow of how a class is created, modified and sunsets. This also allowed me to understand the data structure in the legacy system and how this data was manually turned into the human-legible printed quarterly class schedule.
During this time I had casual conversations with a few Vice Presidents to gauge the institutional appetite for this kind of project.
Prioritizing the Project
Defining an MVP
I participated in some of the research, but this effort was led by another designer and our quality assurance specialist went along to most of the research sessions.
The research was plotted into a Jobs to be Done framework and as a team we decided what jobs the product needed to serve for us to have an MVP.
Side note: During this stage of the project, I was focusing my time on continued conversations with stakeholders and upper administration as well as working on the Web Presence project. I jumped back into the project at this next stage.
Early Design Work
I took the output from this session and started doing sketches of my own and later moved to creating wireframes. I centered my decisions around the Jobs to be Done framework.
Early Wireframes
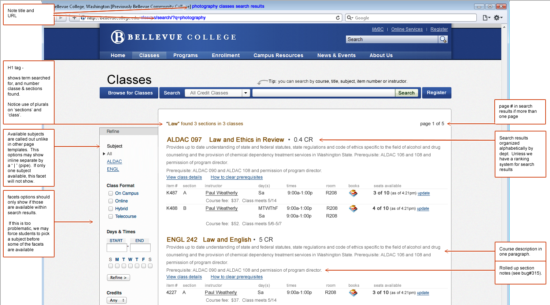
Annotating Wireframes
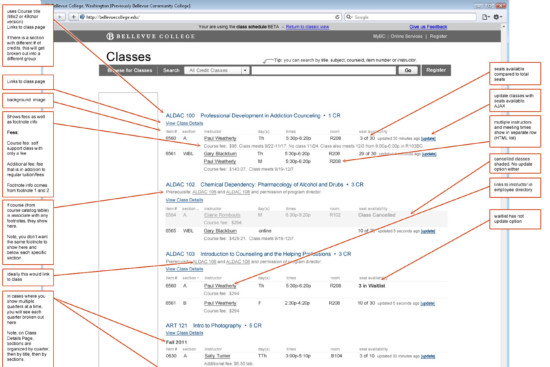
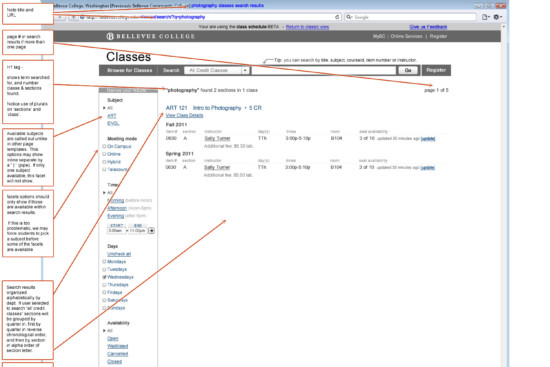
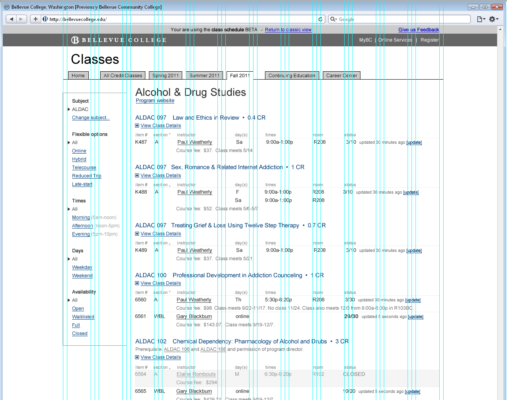
Faceted Filters
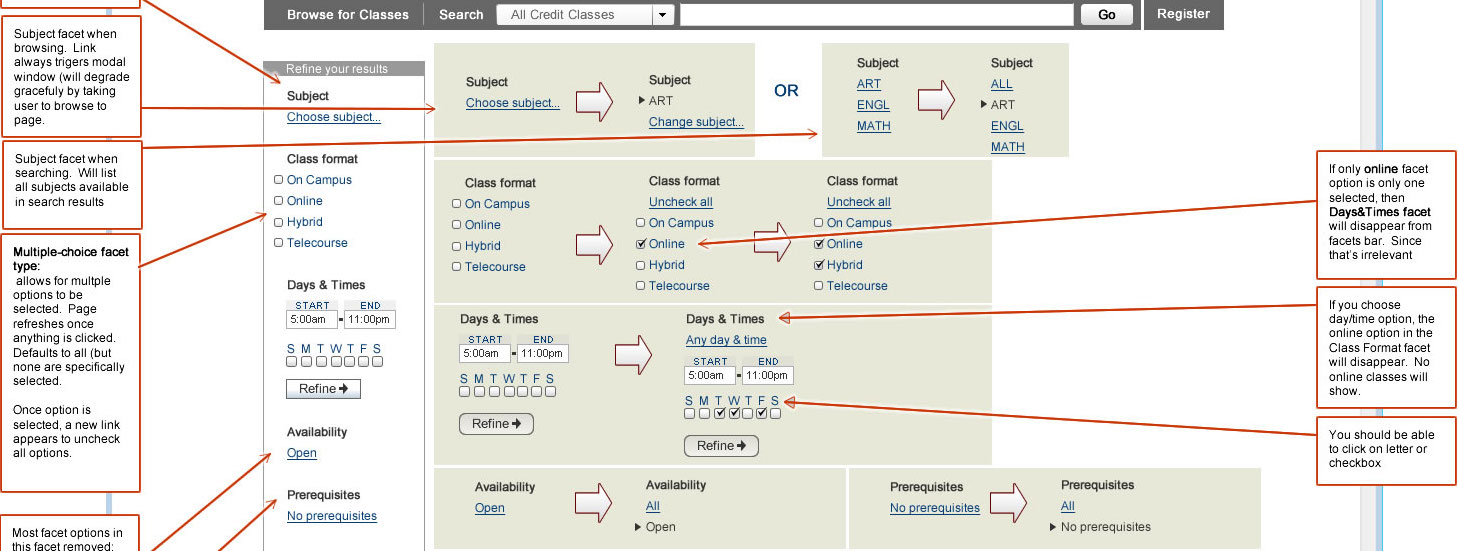
I documented the interaction of all faceted filters in to articulate how each one should work and change as students interacted with them.
Alpha and Beta Versions
We utilized a feedback form to help people report issues with the product. Most of the feedback at first was thank you messages from students and faculty. This gave the project a boost.
During this process, we kept the UI looking exactly like the wireframes, to give people a sense that this was a work in progress.
The wireframes were my design and I implemented the UI. Even though these looked like wireframes, under the hood, the markup was well thought out, semantically accurate and accessible.
Handling the Details
New Approach
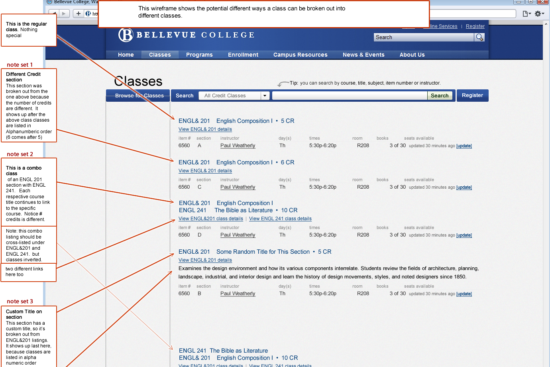
Most colleges list their quarterly/semester class listing in the class schedule (or timetable) and the full courses and descriptions in a document called the Course Catalog. If you try to find this information online, you’ll likely need to go to those two different documents to get the information you seek. The reason for this is that state regulations spell out that colleges need to have course descriptions in a document called the “Course Catalog” and that this document needs to be available online.
At Bellevue College, after conducting some research, we learned that separating this information made it hard for students to find class descriptions and other important information. Because of this, we decided to organize the website by grouping information that made sense together instead of splitting information into an online “Course Catalog”. We still post the ‘Course Catalog” and “Quarterly Class Schedule” online, but as PDFs. Feel free to ping me and ask me how we came to this decision and how I led this separate initiative at Bellevue College.
Faster Workflow
This product is able to cut down the workflow, because now college officials use this product as a tool to proof the information that will eventually be in the printed document. It also generates a document that is preformatted with the proper tags to be imported into their print publishing platform.
Overcoming Technical Limitations
To circumvent the problem we added a refresh trigger on every class, which allowed students to refresh the the availability information for each section. We also time stamped it and added it to the cache. This way students would know how old the information was.
Having this information not only gave students clarity about the status of each class, but it also made the registration system overload less. The registration system was tied to a legacy system and could only handle so many requests at a time before it got overloaded. Our hypothesis was that students were less likely to attempt to register for classes that were full because they had that information readily available to them. This in turn, turned to less concurrent usage of the registration system and less chances to overload it.
About Performance
It wasn’t uncommon for pages in early stages of development to take 30 seconds to load. By the time this project went live, you would never have guessed that performance was an issue because the site is so fast. In fact, some of the most heated conversations between team members in this project was about site speed and caching.
This project helped the entire team improve the way we queried large amounts of data and maintain site-speed. We had to pay close attention to the different levels of caching to ensure that students always saw the most up-to-date class information. As a designer, I had to fully understand these decisions as they impacted the user experience.
My Role
- This was my initiative, built a business case and saw it through to the end.
- Served as the product owner and lead designer: led the vision of the project, point person with all college stakeholders, prioritize the backlog and was the voice of the project.
- Led one of two kick-off design studio sessions. We had so many stakeholders, that we to broke it up into two sessions.
- Planned and conducted some of the user studies during the process.
- Designed the wireframes and final design of the project.
- Implemented a good majority of the HTML in a semantically accurate structure, most of the CSS and some of the javascript & jQuery.
- Conducted comparative analysis of similar tools at other institutions.
- Reviewed feedback provided from the website.
Tools Used
- Design methods: customer interviews, guerrilla user studies, defining audience, competitive analysis, value/complexity matrix, story mapping, sketching, white boarding, wireframes, surveys, proof of concept, roadmap
- Design tools: Fireworks, Illustrator, paper/pen/whiteboards, Google Analytics
- Dev tools: Visual Studio (MVC), TFS, Firebug